Let’s start with a piece by Jorge Luis Borges called “On Exactitude in Science.”
In that Empire, the Art of Cartography attained such Perfection that the map of a single Province occupied the entirety of a City, and the map of the Empire, the entirety of a Province. In time, those Unconscionable Maps no longer satisfied, and the Cartographers Guilds struck a Map of the Empire whose size was that of the Empire, and which coincided point for point with it. The following Generations, who were not so fond of the Study of Cartography as their Forebears had been, saw that that vast Map was Useless, and not without some Pitilessness was it, that they delivered it up to the Inclemencies of Sun and Winters. In the Deserts of the West, still today, there are Tattered Ruins of that Map, inhabited by Animals and Beggars; in all the Land there is no other Relic of the Disciplines of Geography. –Suarez Miranda,Viajes de varones prudentes, Libro IV, Cap. XLV, Lerida, 1658.“
That brief story about mapping can also explain the challenge of performance measurement. Like an ever more detailed map showing us every tree, stream, and gully, we want a measurement system to depict up-to-the-moment aspects of each department activity contributing to a government’s mission. Like the map, though, a city would need a dashboard with an overwhelming number of gauges to accommodate the performance of its agencies. And, in our natural desire for more answers, we also want to know the results of our programs on our community, whether it is gauging the condition of our physical resources or the well-being of our community members.
F.W. Taylor introduced the idea of performance measurement in the late 1890s and it was taken up by industry and, later, governments. Municipal research consulting groups sprang up in the early 1900s and then disappeared. Since then, the ideas have gone through cycles of enthusiastic application and quiet abandonment. Outside forces had some influence on these cycles. The depression in the 1930s put an increased emphasis on government performance and public accountability reporting as cities like Portland assembled books of statistics about work performed. The 1950s benefited from statistical sampling methods, more sophisticated public polling, and systems analysis approaches developed in the previous war. The 1970s offered the first computer information systems and more sophisticated means of analysis, wrapped in Peter Drucker’s Management by Objectives. The 1990s had federal support through the Government Performance and Results Act, as well as the personal computer that allowed cheap data analysis, charting, and reporting. The internet allowed easy exchange of comparative data, which extended the cycle of support.
In the following section I lay out my experiences with all different kinds of measures and how they differ at each level of local government that I worked in: county, city, and state. For a time, Portland and Multnomah County had the most robust performance measures in the country, successfully toeing the line between cost and value—until they didn’t.
These measures share a commonality – they are measures of conditions without causes. Some of those conditions might be considered effects, but still they don’t answer the why question. They are snapshots without context and leave the observer without a story. I have likened them to a dashboard of gauges which inform the driver of conditions but, when something goes wrong, no information about the reason.
I offer no new strategies for successfully sustaining a performance measurement and management system for government services. Its long history of adoption and abandonment over the past century only strengthens my belief that performance auditing is the more cost-effective and enduring means of improvement to meet the complex tasks of our governments.
Financial condition measures
Financial records and accounting practices could be considered some of the earliest measures of conditions. Documenting money transactions goes back millennia in human history and many of our principles of accountability are built on that framework. As our financial systems and technologies developed over the centuries, so did our measures and understanding of financial concerns, or financial health.
Portland. I was offered two possible audit topics by my boss in 1989, when I was a Portland staff auditor: develop a performance measure report about the city bureaus or assess the city’s financial condition. I had developed some measures while I was working in the sheriff’s office and found them an interesting challenge, as they were difficult to develop and a burden to sustain. I chose the financial condition reporting, which applied a methodology developed by the International City Managers Association (ICMA, which was later renamed to include county managers).
Portland finance managers resisted, telling us such an analysis would threaten the city’s Triple-A bond rating. Exposing our financial circumstances could produce no benefits, they said, only liabilities. Any reduction in bond rating would cost taxpayers more for the city’s borrowings, and they would hold the auditor directly responsible. We went ahead despite their warnings.
Using the city’s budget document and audited financial statements, we built spreadsheets to track indicators over a ten-year period. The ICMA guidance suggested about thirty-five indicators but I found that many were difficult to obtain, especially in the area of asset conditions and valuation. Many of the indicators were also interrelated and didn’t provide additional insights into trends. I was lucky to have Eric, a CPA, to help me through some of the details when bureaus were combined, or programs shifted from one bureau to another, or other adjustments occurred in the financial statements.
Trends were the key discovery for me. Big problems seldom arose quickly. Instead, they inched up year by year with little notice. Once discovered, the problem was often too big to easily solve or, more worrisome, to even acknowledge. A growing pension liability is a good example. The one-year snapshot of a budget or actuary report had no direction. But string ten snapshots together and the reader can see the motion of the threat. I also learned that the big problems that took years to develop would probably take years to fix, and that few elected officials showed the leadership to do so.
Issuing such a report during the budget process also emphasized the financial issues for elected officials. The ten-year looks showed them trends in revenue sources, agency expenditures, debt, liabilities, and rainy-day reserves. The measures were based on dollars (adjusted for inflation) so they were accessible for most people. With its charts and explanatory narrative, the report served as a good introduction to city finances for newly elected officials.
We later heard that the city’s finance leaders took the report to New York to show the credit-rating agencies that an independently elected auditor was keeping watch on the city’s financial condition, which they realized should help justify a continued triple-A rating. We recommended the city develop financial policies with explicit thresholds for minimum reserves, policies on fee adjustments, and other key decisions to guide city council. It took several years but they finally produced one. These reports can be easily updated every two years (one year of new data seldom shows a new trend) relatively easily for an ongoing monitoring mechanism.
Multnomah County. After I took office as Multnomah County Auditor in 1991, one of the first topics I scheduled was a financial condition report. The county, never as well-financed as Portland, had been hit much harder by a recent voter-approved tax limit. As Judith, one of the staff auditors, gathered the data, she asked whether she should show the indicator of the county’s reserve funds, of which the county had none. I told her to produce a chart like the others, and show nothing in it. It was a very compelling argument and I was pleased to see leadership respond a couple years later with the beginnings of a reserve fund.
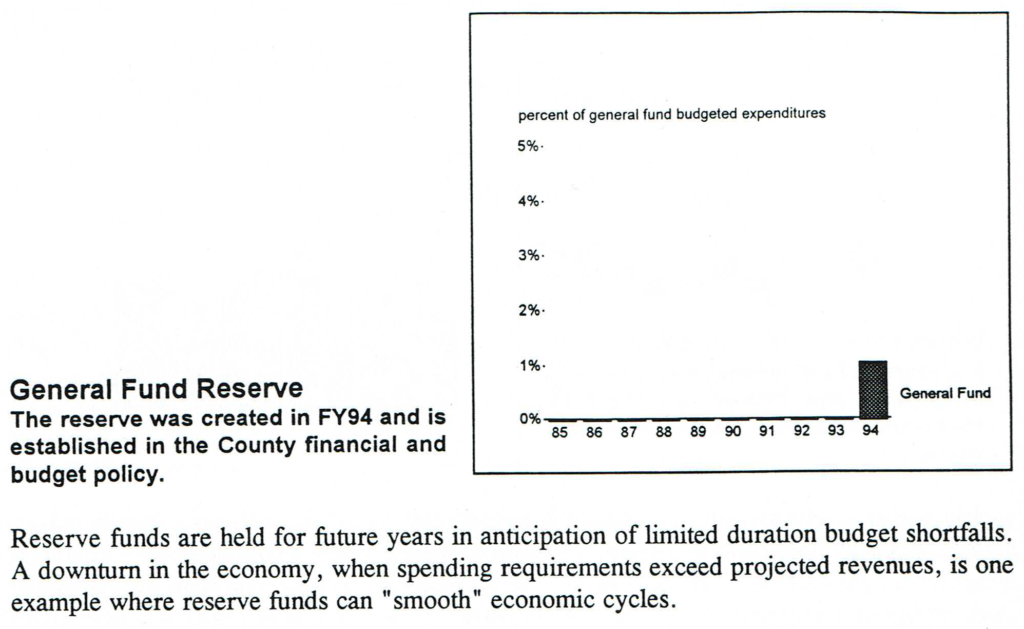
In this case, the county finance office welcomed the report because they wanted the board to develop its budget with greater respect for broad financial considerations. With the impetus of the report the county adopted financial policies in the first year to reinforce sound financial management, among other actions, and county reserves were built up over several years. Subsequent reports reinforced the progress being made to establish a stronger financial footing.
State of Oregon. We produced the state’s first financial condition report in 2011. Again, it provided us with a good understanding of the longer-term trends of revenues and expenditures. That tax limitation experienced by local governments also transferred most of the responsibility for education funding to the state, but without any additional revenue source. Thirty years later, Oregon has still not recovered from that shift and its indicators in some areas—such as “rainy day” reserves—are weak.
We also wanted to track the financial condition of Oregon’s thirty-six counties in 2012 because they were contending with the great recession as well as cutbacks in federal funding from timber harvest proceeds. (In some counties, federal forests comprise over 50% of the area, though not taxable. Shared proceeds of timber sales were a solution that was quite lucrative for counties for many decades.) In later years, we pared down the number of indicators to rank financial condition of the thirty-six counties, then went into depth on those we felt needed to be watched more closely. It was a means for us to distinguish those counties that posed serious financial risks from those that could survive. We asked the five or six most vulnerable counties to respond to our assessment, describing what they were doing to address the financial issues. A few county commissioners were concerned about state overreach but others found it worthwhile to have the discussion, knowing where they stood relative to other counties and that the state had concerns. As the economy improved and counties took action, we were able to reduce the number of counties on the monitor-more-closely list.
One of the advantages of these financial condition reports is the long-term payback for the audit work. The first ten years of data is the most difficult to develop, but updating the report periodically and adding new data takes less effort and produces an equally important report. Again, the most worrisome trends emerge slowly, so every two years is sufficient to spot them. Portland, Multnomah County, and Oregon have all continued producing their financial condition reports. (As the economy has recovered, the state’s assessment of the counties is not so necessary, but the template can be used again if conditions change.)
Measures of service efforts and accomplishments
After I left Portland and went to the county, city auditors continued to produce the financial condition report every two years. While a sound financial position sustains a government, it doesn’t ensure good services to the public. For the public, measures of services help explain what they receive for their tax dollars. For managers, the measures can show success when they undertake new efforts. And measures can be important for elected leaders in budget deliberations about allocating dollars to the various services. All of this can satisfy expectations of transparency and accountability. The framework developed by the Standards board was an early template, and later reports by the GAO refined and reinforced the measurement concepts.
Those are some of the stated reasons for measures, but the reality I observed was much different.
Portland. For nearly two decades Portland auditors produced model reports of vital statistics about each of the major bureaus. The reports displayed a ten-year series of information so trends could be observed in charts and the data, with narrative describing any emerging issues. We also gained the cooperation of auditors from comparable cities to show comparisons. A typical year’s report contained over thirty thousand numbers – dollar figures, levels of community member satisfaction, measures of activities, percent changes – as counted by the son of one auditor.
In addition, auditors conducted an annual mail survey to gauge issues more challenging to measure, such as the feelings that community members had about safety, use of public parks, and conditions of streets. The sample of community members received preview postcards, the survey, and then reminders—a process based upon a methodology proven to increase participation and ensure representative results. For several years we oversampled in order to get community member perceptions at the neighborhood level in the hopes that Portland’s neighborhood associations would build action plans around the biggest concerns.
It didn’t happen all at once. The auditors started with six major bureaus and eventually ended with about a dozen. The addition of a bureau could end in a separate audit report if there were matters of concern raised in the process. Auditors worked with the bureau to analyze its mission and related objectives. They then discussed possible measures for each contributing objective, and worked toward an understanding of what data the bureau was collecting which could be applied as a relevant measure, and then assessed the quality of that data. For each bureau, auditors recommended measures that showed levels of activities and, most importantly, the results of those activities. In the case of the Portland Development Commission, auditors reported that the mission encompassed aspects that were unrelated to its program objectives. And one of its program objectives had no relation to its mission. Its mission needed to be rewritten, at the least, in order to properly declare its purpose for the public.
I marveled at the quality and comprehensiveness of the effort, and others did too. It earned recognition for its clarity, its use of graphics, and its comprehensive look at each bureau’s services and accomplishments. The Standards board noted that Portland’s report was seen as one of the best examples. Yet, as I was leaving after ten years in the city, I told the incoming auditor to carefully consider ending the effort because I didn’t see it producing as much value as it cost in foregone audits. The auditors suspended their work in the office for about four or five months each year to produce the report. As auditors they did all they could to shave unnecessary hours off the preparation, but even then the office was diverting efforts away that could have produced about three or four audits per year. After eighteen years, the reports ended, replaced by a shorter report based on the community member satisfaction survey.
During this period of 1990 to 2005, many measurement regimes competed to be the must-do scheme—Balanced Scorecard, Baldrige Awards, and Organizational Excellence, to name a few. While some department heads might have considered them, the Portland City council members had little interest. One frustrating situation was the budget office’s continued use of its performance measures in the budget document. These measures only reported on a few years, never covered all the key programs in a bureau, were simplistic, and often reported on inputs (number of police officers) without activities and results. Even though the auditor’s report was issued prior to the preparation of the first budget document, the budget office claimed that it could not earn the Government Finance Officers Association certificate of excellence if it substituted our measures report.
Multnomah County. In 1993, while I was auditing at Multnomah County, the newly elected county chair Beverly Stein introduced a performance measurement and budgeting system that eventually developed into the best model I ever saw in the country. (The chair is the county executive and also has a vote on the five-member commission.) She instructed departments to break their costs down by program so true costs of distinct services could be displayed. My office partnered with the budget office to develop training on performance measures, then reviewed the department proposals for relevance and reliability. We studied the training materials and classes that the state was employing for its departments. This had a distinct advantage for county departments. Because the county was carrying out many state-funded and mandated duties in social services and criminal justice, these departments had already been required to track their performance to satisfy state measures. Adopting many of the state agency measures also made great sense because departments were collecting and reporting that data to the state for its measures. Once done, we compiled a report of all the departments, their missions, program objectives, measures, sources of data, and methods of calculation. There were several hundred pages—each dedicated to a single measure—for documentation and to ensure consistency through the years.
Not long after completing this effort I stumbled on a thick old document titled “POPS Manual.” It contained page after page of what we had just completed, but dated from the early 1970s rather than the early 1990s. It was one component of the county’s ambitious Management by Objectives initiative. I felt like I had stumbled on a half-buried dinosaur bone. I saw the names of a few people still around who had worked on that initiative. I asked one department head about the initiative and why it ended. Billi’s answer was simple: “It died under its own weight.” She also ascribed some of its demise to budget cuts that prioritized services to the public rather than paying for staff to enter data and hiring analysts for interpretation.
I think auditors need to consider this liability if they are routinely auditing performance measures. They may be part of that weight. Unless the measures are pay-for-performance contracts, agencies will try to shed the burden of measurement. Agencies may prefer no expenditures for measures rather than investing in measures that are subject to endless auditor scrutiny and recommendations.
Under the chair’s leadership, Multnomah County succeeded in earning the Baldrige award for its continuous improvement initiative. A few years after I returned to the city, the county revised its budget process to incorporate the measures and to build a spending plan around priorities such as basic living needs, safety, accountability, thriving economy, education, and vibrant communities. Programs were individually ranked, relying upon various groups of agency personnel and community members, and on needs and impact. A cutoff line determined whether it would be funded. There was still another chance for approval and program managers could reduce, revise, or take other steps to make another pitch for funding.
This budget approach only lasted a few years though. I don’t know why it was discontinued, but one story I heard was the discomfort it raised for board members. Sometimes board members pulled lower-ranked programs above the cutoff line and the budget process made these maneuvers very obvious as the members attempted to follow through on their campaign promises and pet projects even when more worthy programs were cut.
Oregon. When I became director of the Oregon Audits Division, I was approached by the chair of the state’s Committee on Performance Excellence. He was a business owner and passionate supporter of measures and performance measurement. I explained that I felt uncomfortable serving on a state policy committee but I would attend the meetings and help where I could. I was designated a “friend” of the committee and observed the committee’s efforts to instill the same managing for results ideas in state government. Despite several years of earnest efforts, the ideas were rarely adopted by state leaders or department heads.
School Districts. I was involved in one other indicators effort. Suzanne Flynn, the Multnomah County Auditor, contacted me about a meeting of city, county, and school district leaders to discuss a possible operating levy to supplement school funding. She suggested we attend the meeting in case auditing was discussed. It was a wise suggestion because one thing local leaders have learned is that any ballot measure involving money seems to get a few percent more voters if the effort is “audited.” Sure enough, it came up and we said that if they really intend to promote the auditing language, a standard financial audit wouldn’t be adequate. As a result, the levy included funding for two positions to audit the seven school districts in Multnomah County for three years.
The measure passed and Suzanne took the lead. I helped when needed. We conducted a number of audits, including service efforts and accomplishments and financial condition reports of each district. It familiarized us with the large and small district differences and highlighted some areas to audit.
Community Indicators
Just like financial condition doesn’t help understand how wisely the public funds were spent, service efforts and accomplishment reports don’t describe the conditions and needs in the community where they take place. This narrative provides more history and context about the earlier section entitled, “Measuring the Vigor in Your Community.”
In the late 1980s Oregon introduced “benchmarks” to describe conditions affecting the public. The state had already developed performance measures which described agency activities and results; these new benchmarks addressed themes of “exceptional people, outstanding quality of life, and a diverse, robust economy.” Originally about 135 measures were proposed, addressing topics like high school graduation, teen pregnancies, crime, rural health care, and personal income.
The state linked its agency measures to these benchmarks, often noting that multiple agencies needed to collaborate to address some benchmarks. For example, teen pregnancies needed the attention of both educators and health care providers. This was seen as a smart way to break down the agency “silos” that focused only on their own specific core missions to the exclusion of programs for which they felt no direct accountability.
These benchmarks also prompted collaboration at other levels of government. Baker City, Tillamook County, and many others adopted benchmarks for their communities using the state’s template and some of its measures, while adding some that were of particular importance to their communities. Closer to home, the Multnomah chair, Portland mayor, and Oregon governor joined together to propose the “Oregon Option,” a means of collaboration and a way of reducing red tape with federal funds. Federal administrators took an interest and dozens of representatives of various agencies arrived to be briefed on the ideas. They saw the example of a youngster in childcare who was accounted for in seventeen different federal programs, when a set of outcome measures could be more impactful.
Portland and Multnomah County. The county chair and the mayor created a joint city-county progress board in 1993 that began tracking priority benchmarks selected by gatherings of community members. After several years they approached me and asked if I would take on the project. They made the case that data gathering was a core auditor skill, objectivity would also be valued, and reporting to the public was another responsibility. I saw no independence issues with the project and agreed to take it on.
Community members had selected more than 125 measures, though many lacked any available or even feasible data sources. I also saw that many measures were nearly the same or were only available through the census every ten years. We worked to clean up the measures by developing close approximations, reducing the duplication, and finding new data sources. We were also helped by the Census Bureau’s new American Community Survey which chose Portland as one of its early test sites—one benefit of hosting our federal visitors. We pared the measures down to about 90 and tracked about 65, while adding a few each year as data became available. Because the state was also filling out its measures, we were able to extract county and city data for our own use.
We also focused on individual measures to explore the linkages. For example, we issued a report about school readiness based on early student assessments by teachers. They gathered information on social, motor, and other skills to develop individualized plans. We conducted literature searches on these factors to understand what early strategies could accelerate school readiness. We then inventoried all the programs addressing those factors, their capacity to serve community needs, and funding sources. The board loved the report and began calling it a “benchmark audit” despite my cautions that it was not an audit.
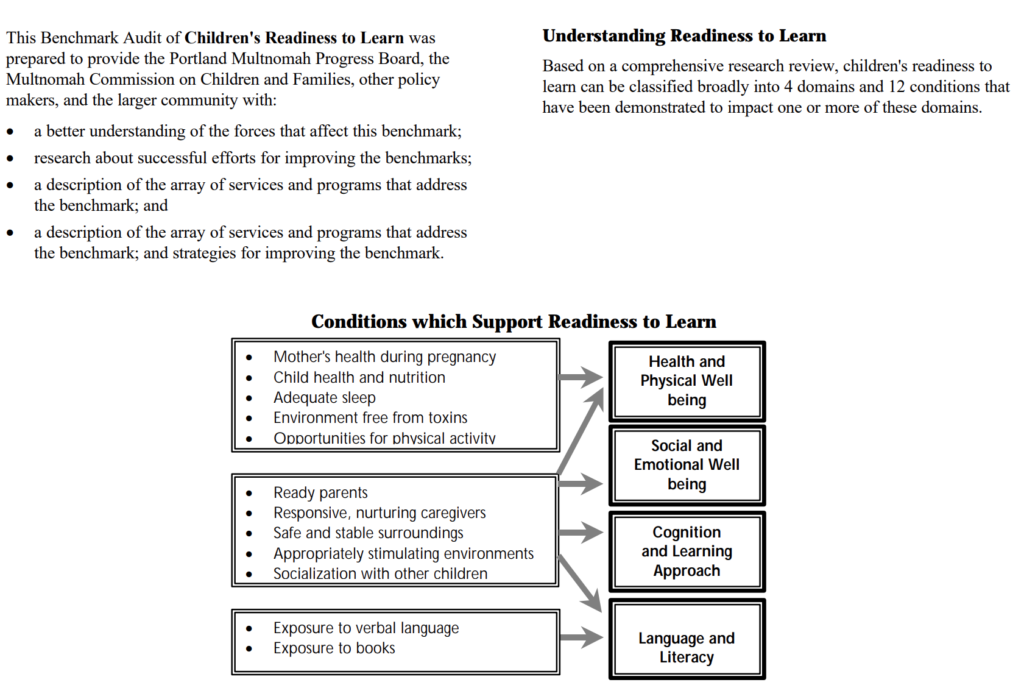
The report was very popular among early learning advocates. We found that the first part, explaining the elements of school readiness, was most useful for promoting the efforts to the public, while the second part on the providers was most useful for collaboration and showing underfunded areas. We followed that template to produce a salmon recovery report for the Johnson Creek basin, located largely in Multnomah County and Portland. We also looked again at education to identify factors leading to high school success.
These benchmark efforts showed the linkage between community conditions and program efforts, but also revealed uncertainties about whether programs were successful. The benchmark on teen pregnancy was a key concern in the early 1990s when many young women, still in high school, became single mothers. We didn’t know the reasons for the epidemic but could foresee the consequences of poor support systems and job prospects on mother and child. Asking them to nurture a ten-pound bag of flour for a week might have had a deterrent effect but the pregnancy counts seemed more a result of social forces than anything that interventions could affect.
The Oregon Option was based upon “outcomes accountability” which would reduce some of the compliance red tape of federal dollars. It was my understanding that the city, county, state, and federal leaders would allow combining of funds from multiple sources into support for measurable outcomes, while distinct tracking of each source would be relaxed if success could be shown. As an auditor, I still feared accountability for some outcomes that were influenced by forces beyond the combined efforts of government, nonprofits, and faith communities. I continued to see the need for accountability on program activities, that the means can’t always justify the ends, and cautioned that integrity and efficiency of programs was still needed.
When I was elected Portland auditor, the city chair and the mayor asked me if I would be willing to continue the benchmark work, and the program was transferred to my new office. Besides our annual updates of benchmark data and benchmark reports, we developed data programs for meetings of the Progress Board. The board was composed of local leaders: several school district superintendents, the Portland State University president, a community college president, housing advocate, United Way director, Ecumenical Ministries leader, business association leaders (one of whom was the creator of the state benchmarks), and several community members.
We prepared Power Point presentations on emerging trends in the community and could display supplementary charts on the fly as the board members asked questions, and discussed the issue and debated strategies to address it. I likened it to a salon where the leaders had an opportunity to foresee trends and commit to work on shared challenges. These monthly meetings were exhilarating for us all. We also sponsored a demographic forum when the first census data was made available. Over a hundred participants heard the previous director of the US Census Bureau speak on long-term demographic trends. We used handheld electronic voting to engage audience members with our panels on patterns of aging, household composition, and migration.
One topic we anticipated was the gentrification in Portland in the mid-2000s. We saw the displacement of African American children to the suburban school districts through the annual community survey data and district enrollment demographics. We alerted Portland’s housing staff who adamantly denied the pattern for nearly a year after that. Gentrification also displaced low-income households to more affordable housing in the suburbs and we showed the data to the state director of human services, who agreed to move that department’s headquarters facility five miles closer to the service population.
While these activities went far beyond my typical audit duties, I saw the vast amount of unused data that could better inform decision-making.
Portland and Multnomah County: The most robust system of measures in the US
No other community in the United States had such a comprehensive body of measures. Metropolitan Multnomah County and Portland were tracking their financial performance and their agencies’ service efforts and accomplishments as well as the conditions in the community. We heard back from program grant writers that the benchmark and program data was invaluable in their work, and sharing benchmarks and performance measures with the state simplified collection and communications. In our audit reports, the data provided background and community context for our findings. Many of the measures and benchmarks were shared with the state to encourage collaboration across levels of government. The governor, Portland mayor, and Multnomah County chair were strong advocates for this system, and the federal government was a helpful participant.
Several stories highlight the unique situation. My wife and I were on vacation in 2005 in the United Kingdom and I made arrangements to meet with the director of performance auditing in Audit Scotland. (I know, it was a vacation, but it was only an hour of my time.) I had been impressed with the Scots’ performance auditing work and appreciated the commonality of our audit findings, even in a foreign land with an entirely different form of government. Imagine my surprise when her very first question was, “Do you know anything about the Oregon benchmarks?” Of course, I knew much more than she could have anticipated and later sent her links to our many reports. We talked a little about performance auditing as well, and many years later, during another vacation, I found an hour to visit with her again and some of her performance audit managers and staff.
One lesson I learned about innovation is that people will beat a path to your door and consume all your time if you let them. It’s gratifying at first, but can become a major distraction. We had dozens of visiting groups of Japanese officials who wanted to know about the benchmarks. The groups numbered from ten to thirty and I learned that one of the local travel companies was arranging the tours. A Japanese professor in the public administration program at Portland State University was usually called upon to translate, and after about six or seven sessions could have answered all their questions without me. I spent hundreds of hours in city hall at a long table facing recorders and digital cameras explaining our methods. At one session I was presented with a bound Japanese translation of our benchmarks report. I was always aware that my attention was being drawn away from the public I served. Had it been more of an exchange of information, it might have been worthwhile, but my questions to these visitors got only brief answers because they had traveled a long distance to get answers from me.
It may seem unnecessary to mention, but all our benchmark information was on the internet. Posting information on the internet was a remarkable feat in the late 1980s. My auditing career began a couple years before the first browser was introduced, and dial-up modems were the slow means of access. As the technology improved, we posted as much as we could, though sometimes just a PDF, which could take several minutes to download. By the mid-1990s the public could view all these performance measures and community measures online.
While I may feel some pride in Portland’s system, I did find one other that was even more impressive. The internet exposed me to the Britain’s Audit Commission which assessed governments and universities on management and performance, and developed something like our benchmarks. I downloaded many of their reports and how-to manuals and spoke by phone with one of trainers. Sadly, it too was redefined and is no longer producing the kinds of reports I admired. The frank assessments probably contributed to the demise of the program. Here is what they said about the Liverpool city council in 2008:
Member behaviour at times is poor and affecting capacity. There has been inappropriate behaviour dealing with some officer issues. Information is sometimes “leaked” to the press and other sources for short-term political advantage. Behaviour of some members at Council meetings is poor with personally abusive language used and aggressive behaviour regularly demonstrated. As a result, some members said that they would not speak at a Council meeting for fear of being shouted at or ridiculed. Trust between officers and members is not effective. Members recognise that the culture of the organisation is not appropriate and stated that the culture needed to change. Behaviour of some members is damaging the reputation of the Council which is recognised by all members.”
Performance measurement, management, and auditing
Besides having a word in common, what is the relationship of performance measurement, performance management, and performance auditing? Having been actively involved in all three, I have some observations.
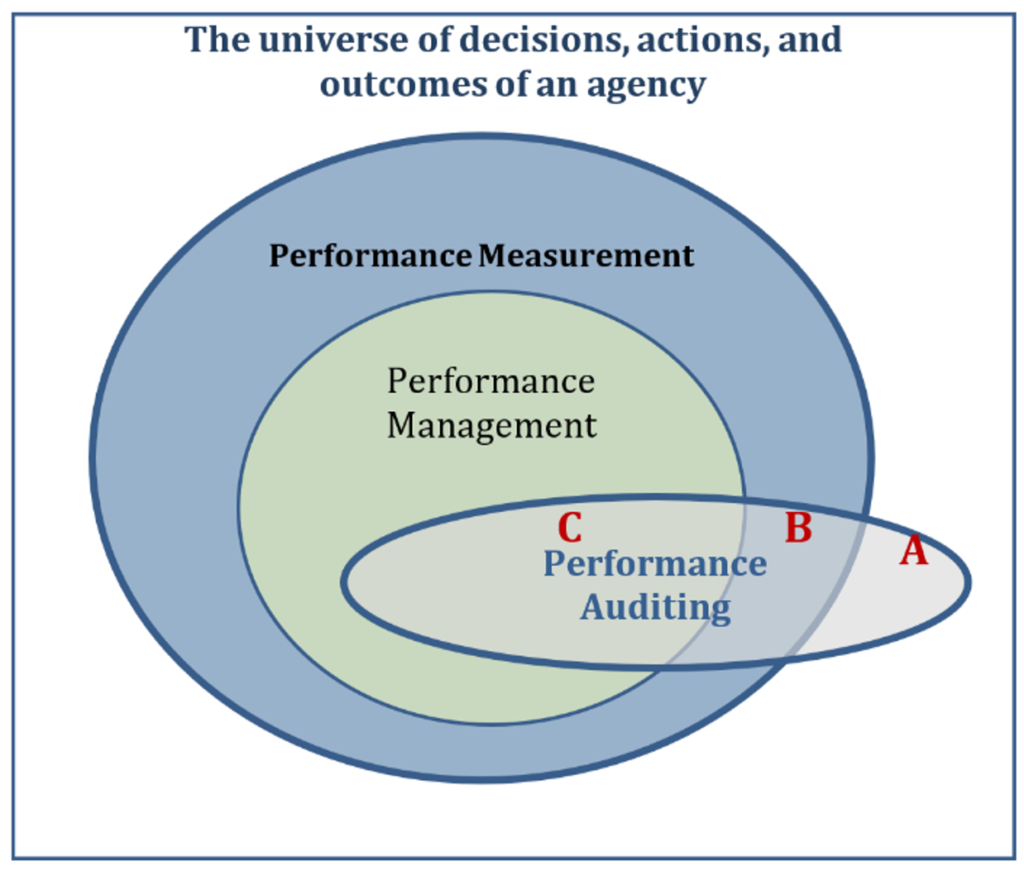
A Venn diagram is a good starting point. The square canvas on which all this occurs is the organization and its operations, which is a universe of decisions and activities and outcomes, every day, day in and day out. The box is not to scale because it is much larger than the collection of all things we can measure. And, only some of them are potentially important to the mission, which is the largest oval, performance measurement. The performance management oval represents those activities that could be worthwhile for an agency to apply the Managing For Results approach.
The smallest oval, performance auditing, straddles all three areas of the diagram because an audit can take it anywhere in the organization and its operations. Moving from the outside square in, (A) an audit may find that a key activity can be improved and needs to be measured for accountability or to boost agency results. Next in, (B) auditors may be auditing performance measures for accuracy and reliability, or more importantly, identifying key measures that the agency is not using for performance management. Lastly, (C) within the inner circle, auditors may identify weaknesses in the agency’s performance management efforts.
You may encounter an agency with some performance measures but no performance management systems in place. Get the data, analyze it, and tell them what they should have done to get better results.
If they have no measures, then observations and sampling may be necessary to document the magnitudes of conditions, effects, and causes. Show why the effort to measure and manage a particular activity will produce better outcomes for the public.
At the other extreme, if they have a robust performance management system and you find no critical gaps, then compliment them and walk away.
In each of these cases, auditors are champions of performance management, with sound performance measurement as a necessary component for its success. An agency that manages its performance well is less likely to produce significant findings because it simply knows the work better than outside auditors, and it can devote more attention to any problems before the auditors show up at the door.
I have seen many jurisdictions kick off a campaign of performance measurement where leadership asks each agency to identify objectives and measures. Government archives contain many dusty records documenting these efforts. Yet measures alone do not produce better services for the public. The performance management piece is critical to improvement, and agencies seldom adopt it with enthusiasm, especially for the long term. From an agency director’s perspective, reporting on measures of operations that are functioning well creates little benefit for the effort, and there are liabilities to reporting on operations that are problematic. The director would rather quietly make adjustments without being called to account. In fact, without public reporting, the director might never have to invent an excuse for ignoring the problem. That’s the force of accountability.
From a cost-benefit standpoint, performance auditing is better than performance management. Here is a metaphor to consider. Think of all the gauges on an automobile; you should be able to list at least twenty. Don’t forget turn signals and bright headlight indicators. Of course, now we have the universal check engine symbol which could mean any of a dozen problems. An underinflated tire doesn’t say why it’s losing air. That’s the point. These gauges tell the driver many general things, but not any cause or context.
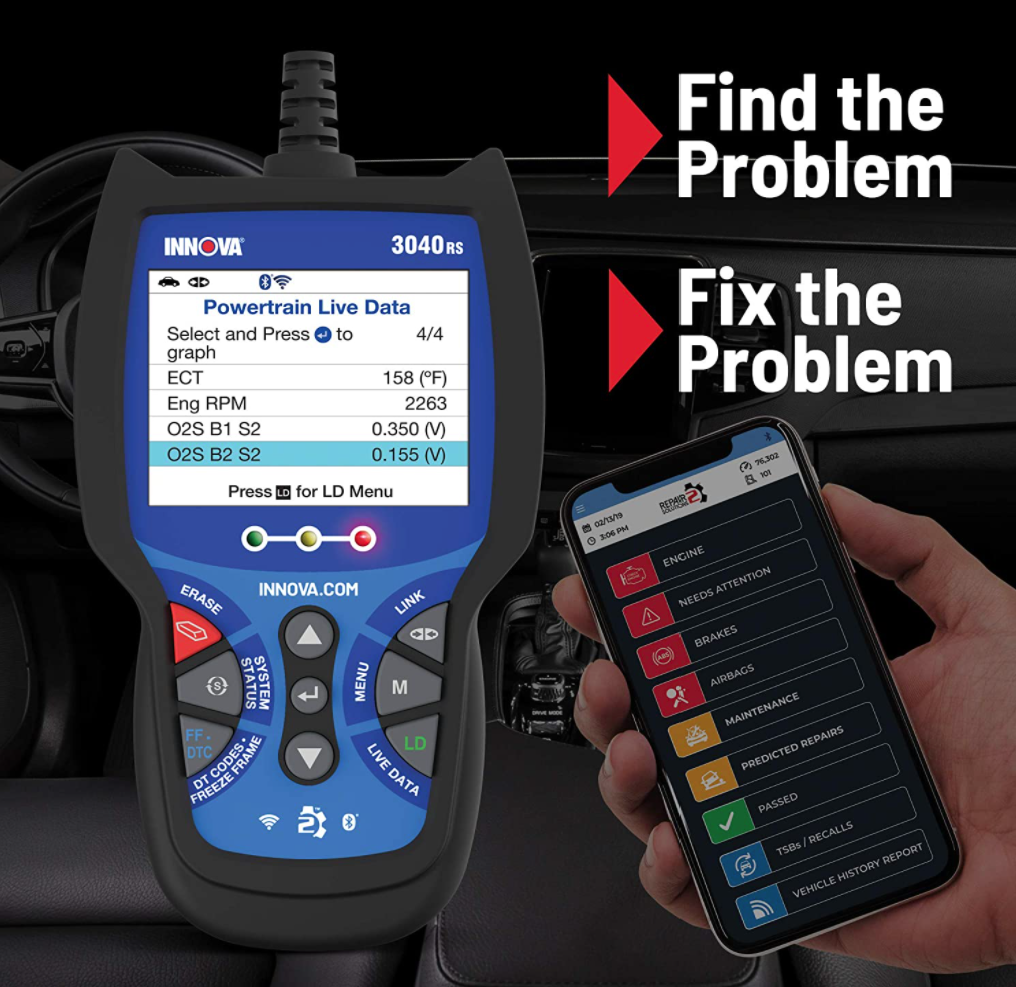
Back to the auto and its check engine light. A well-equipped mechanic will have a diagnostic tool like the one in this illustration that reads the technical operations of the auto. It plugs into the engine and reports on brakes, oil, trouble codes, emissions, battery, tires, and many more conditions. An agency’s performance measurement system contains a lot of raw, passive information. Someone needs to turn the information into an action plan and overcome the inertia to make changes. That rarely happens because agency troubleshooters are not a common position description in government.
A performance management system is based on continuous improvement, which incrementally perfects the delivery of services. If they know their business, management will know where the problems exist. Yet, in the long run, I would put my money on the more targeted effort of an audit rather than performance management because those systems wither and die.
In any other situation, a good audit will find the problem, build a persuasive case for action, and recommend how to fix it. The audit’s public report puts pressure on an agency to address the problem. Simply put, auditing is more efficient—and more effective—at getting improvements in more agencies.
Disaffection
When I was a frontline auditor, it was music to my ears when agency staff told me they received monthly data on operations but that nobody looked at it. We made our request for that data in raw form, then usually found evidence of big problems that needed addressing. Sometimes we found problems through interviews and observations, and though they had no data, the evidence was often on paper and some sampling and data entry could produce a measure of their extent.
Elected officials had different motives, capacity, and needs which explained their interest or disinterest. Performance measures could not be the sole determinant in their decisions about allocating limited public funds to the needs of their community. I described decisions in “head or heart” categories, with data being the head and empathy the heart. Data could determine the best allocation of staff to match workload, or where to site a facility to be most proximate to its clients. It took something more—empathy—to reflect and balance the community priorities about the needs of children, the elderly, victims, and offenders, to name just a few. These value decisions are much more complex. Some of those early champions of data usage only discovered its limits later, and then turned on it.
Some thought the data would provide simple answers. “Every time I point to data about a problem, the department points to other data that says it’s more complicated. Why should I even bother?” one commissioner complained to me. Articles warned that public officials needed to support measurement systems for them to succeed, and in our community, everyone did. But still, the system was later abandoned for many reasons, some obvious, some not.
None of these systems suffered catastrophic failures like fraudulent data reporting or perverse incentive systems, rather they became a disused tool that could be quietly discarded without any of the fanfare present when they were introduced.
Portland. Here are two stories that bookend my ten years as elected Portland auditor. In 1999, the eighth annual Service Efforts and Accomplishments (SEA) report had just been released and I was attending my first city council work session on the budget. The new police chief was making his pitch for a large increase in the number of police personnel and had the support of the mayor. He talked about the many public safety needs he wanted to address and the additional workforce necessary to accomplish it. He even asked for a helicopter. He had Power Point slides with charts to make his pitch. While I had committed to remain mostly silent in my first months, to better learn the role of the auditor in these situations, I had to speak up.
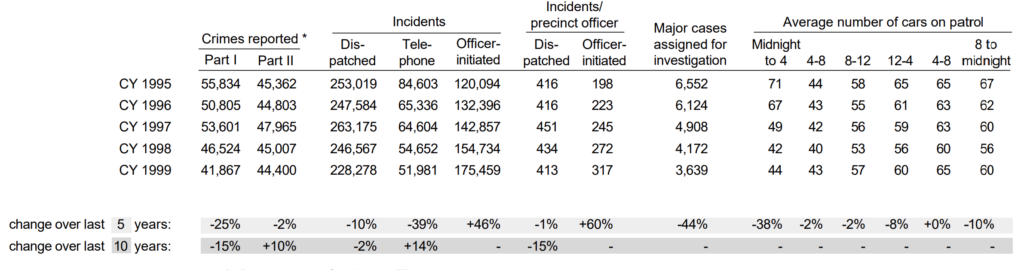
“But Chief, over the past ten years I see a 27% decline in crime and 15% decline in 911 workload, with a 27% increase in police officers and a 49% increase in non-sworn staff. Don’t you think you could use some of that excess capacity to address these needs?”
“Where are you getting that data?” he asked.
“From your bureau, published in our annual SEA report.”
The chief got only a quarter of what he was asking for, mostly as a welcoming gesture. One commissioner later noted with a smile that I had earned my year’s salary with that question.
In my tenth and last exasperating year at the city, I was again sitting in on the budget work sessions. This time, union representatives from the police and non-sworn personnel were making a case that their workload was overwhelming and the council needed to address this critical need. While the numbers were not as dramatic this time, the workload had continued to decline over the past five years and the workforce had remained steady. I spoke up but the mayor (a different one) said they were out of time. I persisted anyway, asking for two minutes. I made my point and one of the commissioners asked where I was getting these numbers.
“From police bureau data posted in our annual SEA report[x],” and held it up. I left the city before the budget decisions were made that year, and I really doubted that my effort to speak up made any difference. Nothing had changed over the ten years. I was the only person in the room with the SEA report on my stack of budget documents. I was the only one who had probably read it. And, again, it was the same troubling circumstance.
In the intervening decade I had advocated many times in public and private meetings, with three different mayors and multiple commissioners, for data-informed decision-making. We issued an audit entitled “Managing for Results: A Proposal for the City of Portland,” that laid out how to keep the city focused on its mission and goals, and to integrate performance measures into its decision-making and management. That got polite nods but little traction.
At one of the community budget meetings (where council members and staff usually outnumbered the community members) I was approached afterward by a man who said with frustration, “I wish someone could just show us what happens with my tax dollars.” He was visibly surprised when I opened my copy of the SEA report and explained how the narrative and charts answered his questions about the fire and parks bureaus. When I offered him my copy of the report he recoiled and said, “No. No thanks, but it’s good to know someone is looking at that.” It was one of the few brief, encouraging moments for me.
Multnomah County. I observed more successful use of measures during my time at Multnomah County. As I was leaving for Portland, the budget process was being redesigned to incorporate the measurement and management system in place. The board needed a method for allocating its dollars in a way that increased the money’s impact on the board’s priority issues in the community. Consultants recommended a system that married the technical aspects of service delivery to the board member expressions of the community’s needs. I left Multnomah County five or six years before its integrated measurement, budgeting and management system was mostly dismantled. Still, the county’s budget document retains the general structure and measures I was involved with, and continues to be much more transparent and useful than Portland’s.
Oregon. During my time as a county and a city auditor, I monitored state methods for developing performance measures and watched the creation of its benchmarks. This was a major effort that suggested a model for local governments, which many adopted. As the appointed state auditor many years later, the state’s measurement system was breaking down.
I also heard from department heads who felt no affinity for their performance measures. Part of the reason was that legislators could impose new or alternate measures on agencies whether those measures were relevant to their core mission or not, and regardless of whether data was available. Perhaps it was a legislator’s pet peeve or favorite cause, but their proposed measures were often impractical or misguided. A department wishing to refine its measures needed bureaucratic and legislative approval, which was an invitation for meddling. The Oregon Audits Division had its own measures, which were quite similar to those used by the GAO and many other audit organizations, and endured perhaps because we answered to an independent elected official.
The state benchmarks, once a national model, were struggling for survival under the third governor since their creation. They were still getting public attention but interest from state leaders was waning, and the small staff was notified that they were not in the governor’s next budget. My boss, the secretary of state, was hoping they could be sustained for two more years until the next governor was elected. She knew of my support and background with benchmarks, and asked if there was anything my office could do. I contacted the staffer responsible for updating the measures. They were willing to perform the task for two more years under a small contract with my office. At least the data would be fresh and available to the public and agencies for their use if the program was resuscitated. Sadly, the next governor had little interest in funding or using them, and we discontinued the contract.
Disinterested public officials
Politicians can be shrewd and perceptive, but math skills are not a requirement for public office. Budgeting is their only real mathematical challenge, and most of them can satisfy that responsibility with addition and subtraction, if they haven’t delegated that detail to a staffer. For elected officials, a table of numbers or a chart required concentration that they avoided in a public setting. Instead, it was better to pretend to know the facts already. If the data talked about a bureau’s performance in their portfolio, they posed as commentators. If the data described public sentiment about any bureau, they would nod as if they knew it already. (You can’t claim to represent the public’s interests if you show you are unaware of them.)
Two stories illustrate the limitations
It must have been about the fourteenth year of Portland’s annual reporting, and we spotted an anomaly that deserved attention. I saw a large improvement in community member satisfaction with our bureau of building permits and inspections. A new commissioner had undertaken an effort to spark changes in the bureau’s lackluster performance. (In Portland’s commission form of government, the commissioners as well as the mayor each manage a portfolio of bureaus.)
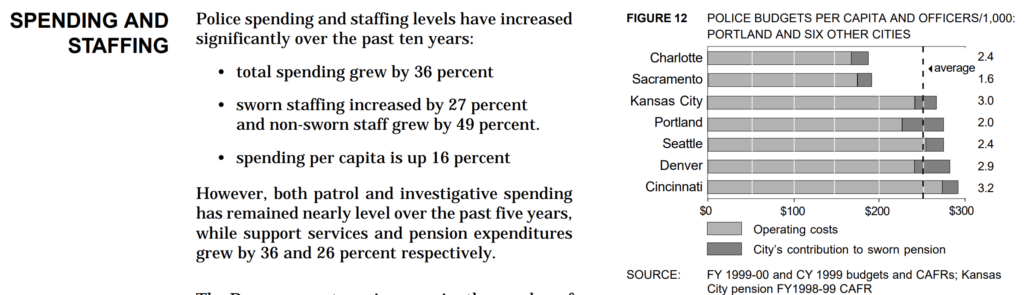
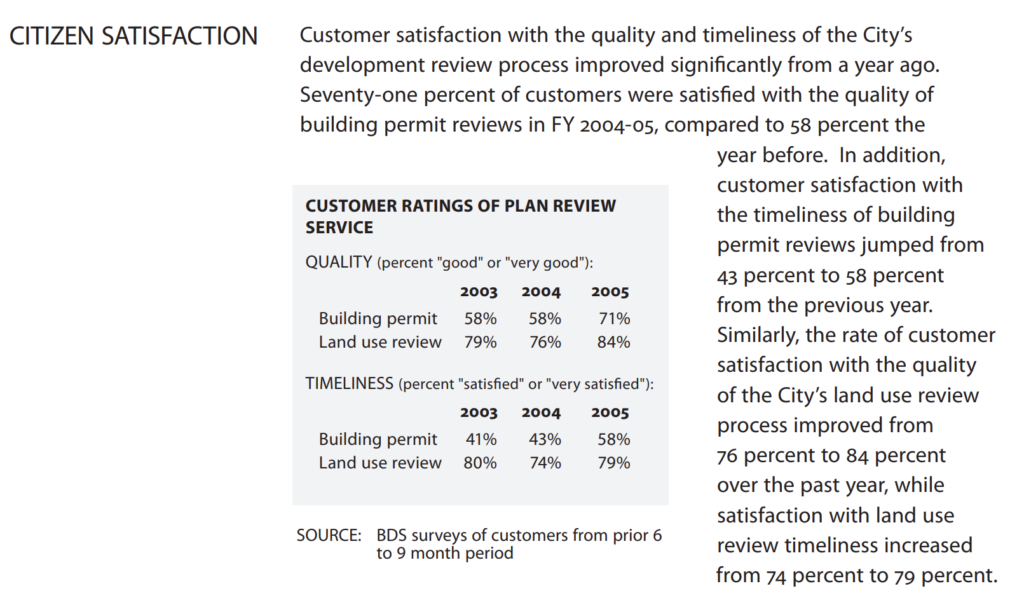
The commissioner replaced the director and top managers, personally met with groups of employees, and emphasized timeliness and better communications with builders and homeowners. As illustrated in the excerpt below, quality of service ratings on building permits jumped from 58% “good” or “very good” to 71% in one year. Timeliness of building permits also improved from 43% to 58%. We were used to seeing annual incremental changes, better or worse, of 2% to 3% in the ratings of city bureaus. We usually had to look for the trends over several years for true indications of change. In this case, we had to double check the survey methodology and concluded these were real indications of improved performance.
I met with the commissioner to explain how remarkable the display of his efforts was. I walked him through the charts and numbers, noting that it was something to be pleased about and to highlight with members of the bureau and the public. He seemed interested, and may have shared it with the bureau, but I never saw him discuss the improvements in public. I had also hoped that pointing out the measures of his bureau would spark some broad discussion at the council level that would bring performance measures into the budget considerations, but that never happened.
The other story is one that disheartened me. One commissioner’s chief of staff expressed an interest in meeting to better understand the information in our reports. I considered him the smartest of the staffers and looked forward to the meeting. Over the years we had refined the narrative, charts, tables, and maps to communicate as clearly as possible what the measures indicated. The Sloan Foundation recognized our reporting and Stan Stenersen, the most respected national trainer in audit report-writing and communications, used our report design as an example for conveying results in the best way possible.
I chose to go through the chapter on the fire bureau, which was in the commissioner’s portfolio. I walked through the summary, then started pointing out some of the issues that raised questions. Fire response times had slipped in recent years, no longer meeting the bureau’s goal. I asked whether something had changed in deployment practices. I suggested a review whether the timeliness goal was appropriate. I showed the differences in response times in some areas of the city and wondered what was causing the differences.
When I finished going through the half dozen pages on the bureau, he was silent for a moment. He said to me that all my questions and suggestions were never apparent to him from the report. I realized that our best efforts to communicate were insufficient for council members or their staff (except the previous mayor, who understood and appreciated it). As a result of that meeting with the staffer, the commissioner had the fire bureau hire some logistics consultants who analyzed the bureau’s workload and deployment data and suggest some changes, including a budget request for an additional fire station.
I also realized that an audit report packaged issues in a simple, neat story that government leaders could grasp and act upon. The SEA short summaries of the agency’s spending, workload, and results revealed many issues, but they didn’t jump out. They lacked the structure of findings that was the impetus for change.
I had also been promoting the data as a means of expanding the vocabulary in budget thinking and management, to include not just words, but numbers, too. Commissioners and bureau directors could talk about issues and use numbers to anchor them to something other than an anecdote or personal theory. Successes could be objectively highlighted and growing problems could be examined for redesign with a new proposed spending plan.
I wanted to hit the highlights of our reports for city council. I asked to make a ninety-minute presentation at the budget kickoff where we would review our financial condition report, the just-released service efforts and accomplishments report, and key benchmarks. This would be part of an all-day retreat, a small fraction of what was probably one hundred hours of deliberations that typically occurred each year.
The city council allowed me ten minutes. I spent that time explaining that their planning process needed a review of the current status, and then to begin identifying areas needing attention, which were explained in our Managing for Results report. I told them it couldn’t be done in ten minutes. It was clear that they had no interest in what the city was accomplishing. Instead, they turned to a pollster who explained the public sentiment from a recent survey.
We had built the dashboard they wanted but it was too much. I pictured a commissioner being seated in the cockpit of a passenger jet looking at hundreds of gauges and dials but unable to comprehend how they worked in harmony to describe the status of the jet’s functioning. The commissioners were elected officials, and people looked to them for direction, so they believed they could not show a hint of uncertainty or inadequacy. Some people might ascribe the officials’ disaffection to Portland’s unique form of government, but other officials in the other forms of government also abandoned measurement systems.
This probably explains my surly response to the mayor at that session when he said that in fifty years the city would no longer be delivering the same services. I had to interject that the public will still need drinking water, streets, sewers, police, parks, and fire services.
This also highlighted a common human—and political—flaw. People love to plan and vision and prepare for the future, but they never look back and seldom assess the current conditions. They see the future as a blank page and not an extension of the present. Newly elected officials like to show how their leadership benefits the voters, and continuous improvement is not part of their repertoire. Putting a government on the right track requires the old to be abandoned and something new and allegedly better be devised.
Complaints about performance measurement
The resistance I encountered sometimes included reasons. They fell into the broad categories below.
Unrealized expectations. Elected officials bought into the idea that performance measurement systems would make their decision-making easier. Consultants and popular management books promoted the many benefits of continuous improvement, but the value decisions still required hard choices and officials didn’t fully grasp the homework that was necessary on their part.
More timely data. As an excuse for not using the SEA report, one staffer complained to a commissioner that the data was not timely. We reported on a fiscal year ending June 30th, and delivered the report in early December. To produce an audit-quality report analyzing thirty thousand numbers in less than six months required an extraordinary effort. I pointed out that performance improvements don’t happen quickly and that the agency performance measures seldom shifted more than two or three percent in a single year; one would think that having data that is six months old is better than flying blind.
More detailed data. I heard a commissioner wish the measures were more detailed so they could evaluate a specific program, rather than the overall bureau accomplishments. He wanted instant evaluations of particular changes he made, which is commendable, but difficult and costly.
Better accountability. Elected officials hoped to use the measures to hold bureau and department heads accountable. They were frustrated to learn that some measures depended upon collaboration with other agencies, some changes were just random sampling error, and that some were strongly influenced by outside factors like demographics. For this and other reasons, I always advocated using the phrase “data-informed decisions” rather than “data-driven decisions.”
Examples abound that performance measures can create perverse incentives. I cautioned about a tight connection with either a carrot or a stick. We run the risk of changing behaviors rather than performance. We’ve all heard the stories of managers who doctor the data to get a bonus or avoid punishment. Numbers turn into scores, scores turn into winners and losers, and losers get fired. I imagine game theory suggests that operating with no measures is the happiest solution (except, perhaps, for the spectators in the stands).
Policy is way more fun than management. Voters like candidates who promise something better, but the debates are usually about the competing visions, not whether they can deliver on that promise. State legislators think their work is done when they chaperone a bill to passage, creating or revising a program through the law-making process. They have little patience for a program that is not perfect from the start, and little interest in thinking about adjustments for improvement. Local elected leaders discover the same rewards for tantalizing futures and simplistic solutions, and the same impatience with plans that often go astray. Measures of results threaten to reveal their failed promises.
Auditors must advocate for sound performance management
A proven means of achieving good government services is performance management. A program that applies itself to those principles will not find itself the subject of significant audit findings. Continuous improvement means self-auditing, a practice we should advocate for.
Within the framework of continuous improvement are performance measures, which in themselves produce little value. Everyone in the organization needs to be devoted to using the data to better inform their decision-making, but the data in itself is incomplete. Measures are only part of the story, as auditors know so well. Too much of reality is missed by measures; leaders need more dialogue to reach sound decisions. Programs are assemblies of people, supplies, support, and procedures to achieve a purpose. Our organizations are not machines, though; objectives are not specific; and success is not certain or complete, even when the program performs well.
We inform and instigate all the time in auditing, and indications of worsening performance measures triggered many of my most worthwhile audits.
As auditors, we should promote the use of measures because our work is informed by objective evidence, and we want government’s decisions and actions to follow the same conviction wherever possible. The measures can show what government is doing and what the results are in our community. No one can reasonably believe that every program or good idea will be perfectly hatched. Feedback and fine-tuning are time-tested methods for improving performance, and without that effort we cannot expect an assemblage of players to spontaneously perform a symphony.
We should support the programs that take those numbers seriously. We should recognize and report about the success of any program that embodies a dedication to organizational maturity by exercising its institutional knowledge, resources, open communication, and self-examination.
We should also caution leaders and programs that a half-hearted effort is worthless. The illusion may work for a while in politics, but will not produce the desired results. We have seen the corruption of managers who falsified good outcomes, and there is the other danger that accompanies this heightened expectation for accountability: using measures to bully. At the county, I told department heads I was willing to come to their defense if any commissioner treated the measures as a cudgel. The abuse of measures always reminded me of the title of a Goya lithograph: “The Dreams of Reason Produce Nightmares.”
I was involved in many performance measurement efforts from the late 1980s until 2008 at the county, city, and state level. These reporting mechanisms were cutting edge in the country, and were studied and replicated in other jurisdictions. I observed cases that can illustrate their value, but I also witnessed the indifference of public officials who saw no value. Measures must be used to have value. Without use, any cost of measurement is too much.
I did my best in my career, and I know others will build upon these and other past efforts.